Water quality is the single most critical factor determining success, survival rate, and profitability in modern commercial aquaculture. Discover how low-power LoRaWAN wireless telemetry packages—combining matched sensors, dedicated nodes, and outdoor gateways—revolutionize real-time monitoring in fish, shrimp, and shellfish farming while eliminating expensive field cabling.
The Growing Need for Real-Time Water Quality Monitoring in Aquaculture
In global aquaculture operations—spanning freshwater fish ponds, coastal shrimp farms, and intensive recirculating aquaculture systems (RAS)—water quality fluctuations happen rapidly. Unseen shifts in dissolved oxygen, sudden pH drops, or spikes in ammonia levels can trigger catastrophic stock mortality within hours, leading to devastating financial losses for farm operators.
Historically, farmers relied on manual water sampling using hand-held meters or sending samples to external laboratories. However, manual spot-checking suffers from inherent delays, human sampling error, and an inability to provide continuous night-time coverage—precisely when dissolved oxygen levels naturally plummet due to biological respiration.
To overcome these challenges, modern smart farming relies on continuous, automated wireless aquaculture water quality monitoring systems. By deploying IoT-enabled field telemetry packages, farm managers receive real-time parameter updates every few minutes, direct to their smartphones or PC dashboards, enabling immediate intervention before water conditions reach critical thresholds.
Critical Water Parameters and Their Impact on Aquatic Species
Effective water quality management requires monitoring specific chemical and physical parameters that directly influence fish metabolism, growth rates, immune system health, and feed conversion ratios (FCR).
Parameter
Optimal Commercial Range
Critical Hazard Threshold
Impact on Aquaculture Livestock
Dissolved Oxygen (DO)
5.0 to 9.0 mg/L
< 3.0 mg/L (Hypoxia)
Low DO causes severe stress, feed refusal, aquatic surface respiration, and mass asphyxiation mortality within hours.
pH Value
6.5 to 8.5 pH
< 5.5 or > 9.5 pH
Extreme pH levels damage fish gill membranes, impair osmotic regulation, and increase toxicity of ionized ammonia.
Electrical Conductivity (EC / Salinity)
Species Specific (0.5–35 mS/cm)
Sudden Osmotic Shifts
Drastic salinity changes disrupt osmoregulation, leading to stress, disease susceptibility, and reduced growth rates.
Turbidity / Total Suspended Solids
< 30 NTU (Species dependent)
> 100 NTU
Excessive turbidity blocks sunlight, prevents photosynthesis, clogs delicate fish gills, and indicates heavy organic loading.
Water Temperature
22°C to 28°C (Tropical species)
Uncontrolled Thermal Spikes
Directly dictates metabolic rate, oxygen solubility (warmer water holds less DO), and biological pathogen proliferation.
Traditional Manual/Wired Monitoring vs. LoRaWAN Wireless Telemetry
When selecting water quality instrumentation for large-scale aquaculture facilities, farm engineers must weigh installation complexity, labor costs, maintenance friction, and data continuity.
Traditional wired setups require running thousands of meters of signal and power cables through muddy embankments and corrosive saltwater environments, leading to high failure rates from line damage, rodent chew-through, and lightning strikes. Conversely, LoRaWAN (Long Range Wide Area Network) radio technology provides multi-kilometer long-range coverage with ultra-low power consumption, making it the ideal wireless protocol for wide-area pond monitoring.
Comparison Metric
Manual Spot Testing
Traditional Wired System
BGT LoRaWAN Telemetry Package
Data Continuity
Intermittent (1–2 times daily)
Continuous (24/7)
Continuous 24/7 Real-Time Telemetry
Installation & Cabling
None
High cost, trenching & cabling required
Zero long-distance cabling (Plug and Play)
Power Infrastructure
Batteries in handhelds
Requires continuous grid AC power lines
Autonomous Solar Power or Long-Life Lithium Battery
Night-Time Coverage
Poor / High labor requirement
Automated
Automated instant SMS/App emergency alerts
Pond Scalability
Labor-constrained
Extremely difficult to add new points
Highly Scalable (Add extra 1:1 paired nodes anytime)
Overall ROI
High hidden labor cost
High upfront infrastructure investment
Fast Payback (< 6 months via loss prevention)
BGT-Hydromet 1:1 Sensor-Node Architecture for Aquaculture Ponds
To deliver maximum operational reliability without complex multi-channel wiring, the BGT-Hydromet Aquaculture Monitoring Package employs a pre-configured "One Sensor to One Node" (1:1 Paired) physical architecture. This ensures modular flexibility, where single probe failures never take down an entire pond network.
Package Hardware Breakdown
Industrial Aquaculture Probes (RS485 Modbus-RTU): Includes optical dissolved oxygen sensors (low maintenance without membrane replacement), glass/solid-state pH electrodes, digital EC/salinity meters, and turbidity probes. Designed with heavy-duty IP68 submersible bodies and chemical-resistant housings suitable for saltwater and brackish conditions.
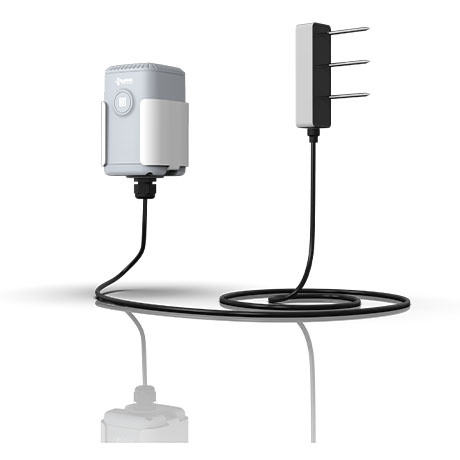
Dedicated LoRaWAN Wireless Transceiver Nodes: Each individual probe connects directly to its own dedicated IP67 waterproof LoRaWAN field node. The node handles sensor power supply, reads Modbus telemetry data, and transmits data packets wirelessly over global sub-GHz bands (EU868, US915, AU915, AS923). Available in solar-rechargeable or internal battery-powered configurations.
Heavy-Duty Outdoor LoRaWAN Gateway: Mounted on a central tower or control room pole, a single rugged gateway aggregates wireless signals from dozens of 1:1 sensor-node pairs across hundreds of aquaculture ponds within a 2 to 10 km radius, uploading compressed payloads to the server via 4G cellular or Ethernet backhaul.
Cloud Management Platform & Mobile App: Provides farm managers with intuitive dashboard visualization, custom threshold setting (e.g., alert when DO drops below 4.0 mg/L), historical trend graphing for feed optimization, and open MQTT/API connectivity to trigger automated aerator relays.
System Deployment & Field Installation Best Practices
Proper field installation ensures accurate sensor readings, prevents biological bio-fouling, and extends the operational lifespan of electronic components in harsh farm environments.
Step 1: Strategic Sensor Placement in Ponds
Do not place sensors immediately adjacent to water inlets, chemical dosing points, or directly in front of paddlewheel aerator splash zones, as this creates localized artificially inflated oxygen readings. Install sensors at a representative depth (typically 0.5 to 1.0 meters below the surface) where fish or shrimp naturally congregate.
Step 2: Securing the 1:1 LoRaWAN Node and Solar Panel
Mount the dedicated LoRaWAN node on a fixed floating buoy or a sturdy wooden/metal bank pile. Position the solar panel facing south (in the Northern Hemisphere) or north (in the Southern Hemisphere) at an angle of 30° to 45° to ensure optimal year-round sunlight exposure for continuous battery charging.
Step 3: Gateway Height and Antenna Positioning
Mount the main outdoor gateway antenna as high as possible (minimum 3 to 5 meters above ground level) to establish clear line-of-sight across surrounding pond embankments and avoid RF signal attenuation from dense tree canopies or metal shed roofs.
Step 4: Sensor Maintenance and Calibration Schedule
In aquaculture environments, bio-fouling from algae, bacterial biofilm, and mud buildup can cause sensor drift over time. Follow this recommended maintenance routine:
Bi-weekly Inspection: Gently wipe probe sensing membranes with a soft cloth or sponge to remove algae layer.
Monthly Calibration Check: Verify pH sensors using standard pH 4.01, 7.00, and 10.01 buffer solutions. Check optical DO probes in air-saturated water.
Seasonal Overhaul: Inspect cable seals, waterproof glands, and node IP67 O-rings to prevent moisture ingress.
Data Analysis & ROI Calculation for Commercial Farms
Investing in automated IoT water telemetry provides a quantifiable return on investment (ROI) through yield protection, electricity optimization, and feed efficiency improvements.
Real-World Case Study: 50-Pond Commercial Shrimp Farm Analysis
Consider a 50-pond commercial Pacific White Shrimp (Litopenaeus vannamei) operation transitioning from manual morning/evening spot tests to a fully automated BGT LoRaWAN water quality telemetry network.
Operational Metric
Before IoT Deployment (Manual)
After BGT LoRaWAN Deployment
Financial Impact / Savings
Annual Mortality Events
2 Ponds lost per year due to night DO drops
0 Critical mortality events recorded
+$35,000 saved in lost crop value
Aerator Power Consumption
Aerators run continuously on fixed schedule
Automated aerator cycling based on real DO
18% Reduction in electricity diesel costs ($8,200 saved)
Feed Conversion Ratio (FCR)
FCR = 1.65 (Feeding during low-DO stress)
FCR = 1.42 (Feed adjusted according to DO/Temp)
14% Feed Cost Reduction ($12,500 saved annually)
Labor Allocation
3 Full-time technicians for daily testing
1 Technician for weekly spot verification
Redeployed labor to farm maintenance ($14,000 value)
Total Annual Benefit
--
--
+$69,700 / Year Net Savings
With an initial turnkey hardware setup cost for 50 paired sensor-node units and central gateways, the complete system pays for itself in less than 5 to 7 months of continuous operation, making it an indispensable asset for commercial aquaculture enterprises.
Frequently Asked Questions (FAQ)
Q1: Why is optical dissolved oxygen (DO) preferred over galvanic/polarographic sensors in aquaculture?
A: Optical DO sensors measure oxygen fluorescence quenching, requiring no electrolyte replacement, no membrane changes, and zero water flow across the sensor tip. This drastically reduces maintenance frequency in muddy or bio-fouling aquaculture ponds compared to traditional galvanic probes.
Q2: What is the maximum distance between a pond sensor node and the gateway?
A: In flat, open outdoor pond environments with line-of-sight conditions, LoRaWAN wireless transmissions comfortably reach distances of 3 to 8 kilometers (1.8 to 5 miles) using standard omnidirectional antennas.
Q3: Can these sensor nodes automatically turn on pond aerators when oxygen is low?
A: Yes. Data transmitted to the BGT cloud platform or your local PLC server can trigger automated control rules via MQTT/API relay modules, automatically powering on paddlewheel aerators when DO drops below a set threshold and turning them off when oxygen recovers.
Q4: How do we select the correct LoRaWAN frequency for our country?
A: Devices are factory pre-configured prior to dispatch based on your regional wireless communications standards: EU868 for Europe and Africa, US915 for North America, AU915 for South America and Australia, and AS923 for Southeast Asia.
Upgrade Your Aquaculture Farm with Wireless Telemetry Today
Protect your aquatic stock, optimize aeration power costs, and eliminate field cabling headaches. Contact BGT-Hydromet's IoT engineering specialists for a customized quote and network design tailored to your pond layout.
Tell us your target parameters, number of ponds, and location for a fast, factory-direct proposal!