Views: 0 Author: Site Editor Publish Time: 2025-09-20 Origin: Site
From Scheduled Guesswork to Data-Driven Precision
For solar asset managers, soiling isn't just dirt; it's a direct threat to profitability. Traditional calendar-based cleaning cycles are inefficient, often wasting resources on unnecessary washes or allowing energy production to bleed away during prolonged soiling events.
This case study illustrates how implementing a data-driven strategy with BGT Hydmet's PV soiling monitoring device transformed operations for a large-scale solar plant, maximizing energy yield and slashing operational costs.
Site: A 100MW utility-scale PV plant in an arid, dusty region.
Initial Strategy: Reactive, calendar-based cleaning every two weeks.
Problems:
Under-Cleaning: Rapid dust accumulation after storm events led to significant power loss while waiting for the next scheduled clean.
Over-Cleaning: Cleaning often proceeded even after rain or wind had naturally remediated the problem, wasting water, labor, and financial resources.
Goal: Transition to a proactive, "on-demand" cleaning regime based on precise, real-time data to protect revenue and optimize O&M spending.
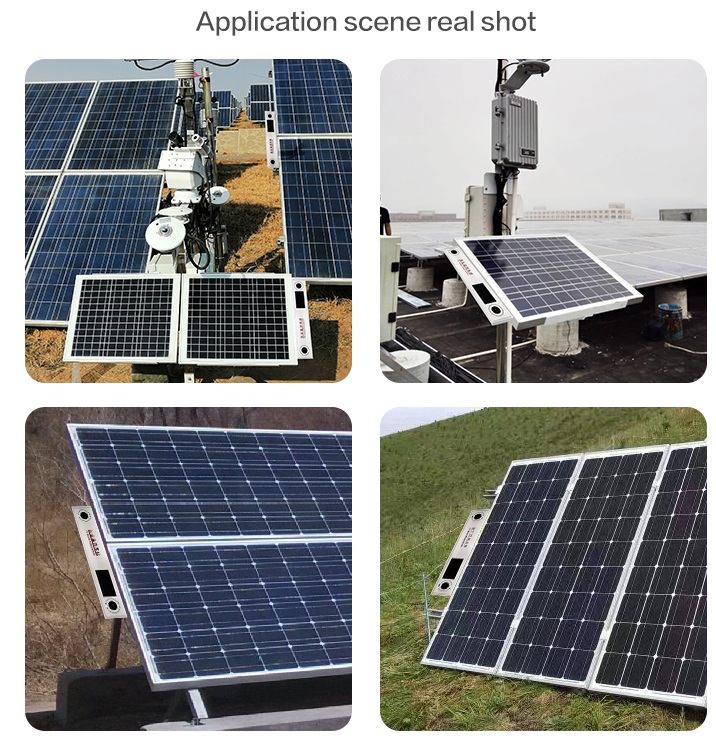
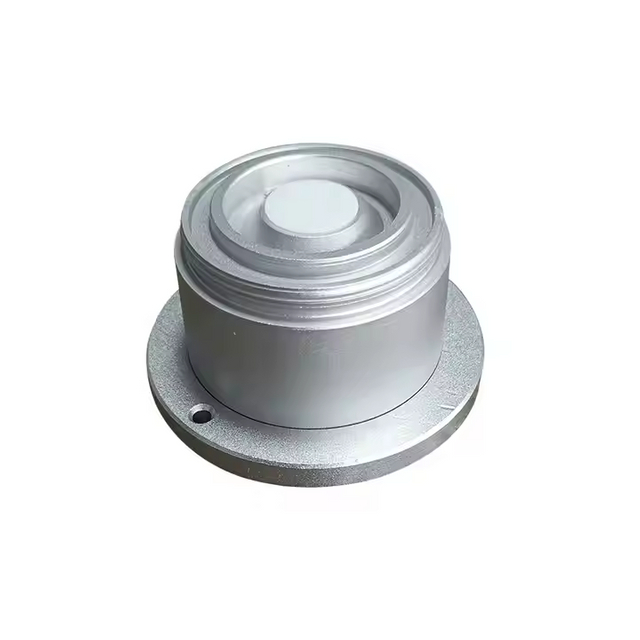
The site installed multiple BGT Hydromet dust sensors for solar energy across representative arrays. These devices provided continuous, real-time measurement of the Soiling Ratio (SR) – a direct indicator of transmission losses caused by dust on the panels.
This data was integrated into the plant's SCADA and asset management platform, allowing the team to correlate soiling levels with actual DC power output and historical weather data.
Within weeks, the plant operators developed a precise "soiling-loss model":
They determined that an SR value of 95% (indicating a 5% loss of light transmission) correlated to an average DC power loss of approximately 4%.
At SR values below 92%, power loss accelerated significantly, and the risk of module hot-spotting began to increase.
The power of this data is best shown through a real-world weather scenario over a 7-day period:
Day 1: Clear skies, clean panels (SR = 98%).
Day 2: A major dust storm hit, causing the SR value to plummet to 90% within hours and stabilizing at 92%.
Day 3: High winds naturally partially cleaned the arrays, improving the SR to 94%.
Day 4-5: Stable, dry weather with slow dust accumulation, SR drifting back down to 93%.
Day 6: A brief, overnight rain shower naturally cleaned the panels, restoring the SR to 97%.
Day 7: Clear weather returned.
Old Strategy (Fixed Schedule):
A cleaning was scheduled for Day 7. This meant:
Significant Production Loss: The array operated at a significant deficit from Day 2 through Day 5.
Wasted Resources: The cleaning crew was dispatched on Day 7, even though rain had already solved the problem on Day 6. This resulted in a completely unnecessary OPEX expenditure.
New Strategy (BGT Hydromet Data-Driven):
The PV soiling monitoring system triggered intelligent responses:
Day 2: The system generated an immediate alert as the SR crossed the pre-set loss threshold. Operators dispatched the cleaning crew to the most affected zones, mitigating the deepest production losses.
Day 3: While the SR (94%) was still near the threshold, the system recognized the improving trend and forecasted potential rain. It recommended delaying further cleaning.
Day 6: After the rain, the sensors confirmed the panels were clean (SR = 97%). The system automatically canceled the pending cleaning work order, preserving the quarterly cleaning budget.
By switching to a cleaning strategy triggered by the BGT Hydromet dust sensor for solar energy, the plant achieved dramatic financial improvements:
The core difference can be summed up in two words:
Desert Challenge: Abrasion & Overheating. The enemy is fine, abrasive sand that infiltrates, grinds, and blocks, combined with extreme UV radiation and temperature swings.
Coastal Challenge: Corrosion & Congestion. The enemy is salty, humid air that corrodes electronics and causes condensation, which can combine with damp dirt to create cement-like sludge.
This fundamental difference drives entirely different maintenance schedules and costs.
Understanding these challenges is why we engineer our PV soiling monitoring devices with specific features to minimize this maintenance burden and lower your TCO.
For Desert Plants:
Robust Air Filtration: Multi-stage, easy-to-replace filters designed for high dust load.
Passive Cooling & UV-Resistant Housings: Engineered to operate reliably in extreme heat without internal fans that can suck in dust and fail.
Automated Self-Cleaning: Options like compressed air jets keep optical surfaces clear for longer periods between manual maintenance.
For Coastal Plants:
Marine-Grade Materials: Stainless Steel 316L brackets and fixtures provide superior resistance to salt spray corrosion.
Conformal Coating: Critical internal PCBs are protected by a special coating that shields them from moisture and corrosive agents.
IP68 Hermetic Sealing: The highest level of ingress protection ensures salt-laden moisture cannot penetrate the core sensor module.
Yes, maintaining a precision instrument in a harsh environment requires a planned and budgeted approach. However, as our previous case study showed, the insight gained is worth far more than the maintenance cost.
The data from a BGT Hydromet system doesn't just prevent revenue loss from soiling—it directly tells you when and wheremaintenance is needed, optimizing that cost as well. It transforms your maintenance strategy from a reactive cost center into a proactive, profit-protecting function.
Would you like to spec a system designed for your environment's specific challenges?
Contact us here for a detailed solution and datasheet. 
This case demonstrates that soiling management is no longer about guesswork. It's a precise science.
BGT Hydromet's monitoring solutions provide the critical data needed to:
Protect Revenue by preventing unnecessary production losses.
Slash OPEX by eliminating wasteful cleaning cycles.
Make Intelligent Decisions by integrating real-time soiling data with weather forecasts and operational costs.
Ready to optimize your solar asset's performance? Contact BGT Hydromet today to request a custom ROI analysis based on your plant's specific location and conditions.